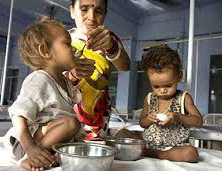
The State-wise details of prevalence of malnutrition among children as per the National Family Health Survey – 4 (NFHS-4) are given below:
Prevalence of Underweight, Stunting, Wasting and Anaemia among children under 5 years of age as per National Family Health Survey 4 (2015-16)
| S. No. | State | Underweight | Stunting | Wasting | Anaemia |
| 1 | Andaman & Nicobar | 21.5 | 23.3 | 18.9 | 49 |
| 2 | Andhra Pradesh | 31.9 | 31.4 | 17.2 | 58.6 |
| 3 | Arunachal Pradesh | 19.4 | 29.3 | 17.3 | 54.3 |
| 4 | Assam | 29.8 | 36.4 | 17 | 35.7 |
| 5 | Bihar | 43.9 | 48.3 | 20.8 | 63.5 |
| 6 | Chandigarh | 24.5 | 28.7 | 10.9 | 73.1 |
| 7 | Chhattisgarh | 37.7 | 37.7 | 23.1 | 41.6 |
| 8 | Delhi | 27 | 31.9 | 15.9 | 59.7 |
| 9 | Dadra Nagar Haveli | 38.8 | 41.7 | 27.6 | 84.6 |
| 10 | Daman & Diu | 26.7 | 23.4 | 24.1 | 73.8 |
| 11 | Goa | 23.8 | 20.1 | 21.9 | 48.3 |
| 12 | Gujarat | 39.3 | 38.5 | 26.4 | 62.6 |
| 13 | Haryana | 29.4 | 34 | 21.2 | 71.7 |
| 14 | Himachal Pradesh | 21.2 | 26.3 | 13.7 | 53.7 |
| 15 | Jammu & Kashmir | 16.6 | 27.4 | 12.1 | 43.8 |
| 16 | Jharkhand | 47.8 | 45.3 | 29 | 69.9 |
| 17 | Karnataka | 35.2 | 36.2 | 26.1 | 60.9 |
| 18 | Kerala | 16.1 | 19.7 | 15.7 | 35.6 |
| 19 | Lakshadweep | 23.6 | 26.8 | 13.7 | 53.6 |
| 20 | Madhya Pradesh | 42.8 | 42 | 25.8 | 68.9 |
| 21 | Maharashtra | 36 | 34.4 | 25.6 | 53.8 |
| 22 | Manipur | 13.8 | 28.9 | 6.8 | 23.9 |
| 23 | Meghalaya | 28.9 | 43.8 | 15.3 | 48 |
| 24 | Mizoram | 12 | 28.1 | 6.1 | 19.3 |
| 25 | Nagaland | 16.7 | 28.6 | 11.3 | 26.4 |
| 26 | Odisha | 34.4 | 34.1 | 20.4 | 44.6 |
| 27 | Punjab | 21.6 | 25.7 | 15.6 | 56.6 |
| 28 | Puducherry | 22 | 23.7 | 23.6 | 44.9 |
| 29 | Rajasthan | 36.7 | 39.1 | 23 | 60.3 |
| 30 | Sikkim | 14.2 | 29.6 | 14.2 | 55.1 |
| 31 | Tamil Nadu | 23.8 | 27.1 | 19.7 | 50.7 |
| 32 | Telangana | 28.3 | 28 | 18 | 60.7 |
| 33 | Tripura | 24.1 | 24.3 | 16.8 | 48.3 |
| 34 | Uttar Pradesh | 39.5 | 46.2 | 17.9 | 63.2 |
| 35 | Uttarakhand | 26.6 | 33.5 | 19.5 | 59.8 |
| 36 | West Bengal | 31.5 | 32.5 | 20.3 | 54.2 |
| India | 35.7 | 38.4 | 21 | 58.4 |
The details of the money allocated under the Supplementary Nutrition Programme of the Anganwadi Services (previously ICDS) under the Umbrella Integrated Child Development Services Scheme during the last three years, State-wise and year-wise, are given below:
State/UT-wise Fund allocated under the Anganwadi Services Scheme (previously ICDS) during last 3 years
(Rs. In Lakh)
| S. No. | State/UTs | 2016-17 | 2017-18 | 2018-19 | |||
| SNP | GENERAL | SNP | GENERAL | SNP | GENERAL | ||
| 1 | ANDHRA PRADESH | 33996.12 | 29181.74 | 32916.43 | 22222.12 | 39530.13 | 28884.89 |
| 2 | BIHAR | 58085.28 | 44755.08 | 54423.27 | 38381.93 | 70750.25 | 47613.06 |
| 3 | CHHATTISGARH | 19992.11 | 23544.28 | 22699.81 | 19351.46 | 27099.81 | 23943.28 |
| 4 | GOA | 498.28 | 917.67 | 664.6 | 530.03 | 863.98 | 721.02 |
| 5 | GUJARAT | 21973.18 | 28651.54 | 28235.82 | 21604.78 | 32535.82 | 25716.23 |
| 6 | HARYANA | 6575.13 | 14834 | 6342.75 | 10888.88 | 7645.58 | 13080.7 |
| 7 | JHARKHAND | 18153.74 | 22688.66 | 25140.96 | 16057.34 | 29083.25 | 19003.49 |
| 8 | KARNATAKA | 41444.92 | 32470.64 | 45222.48 | 26394.44 | 49589.22 | 31161.5 |
| 9 | KERALA | 6280.32 | 20509.06 | 8296 | 14255.09 | 10784.8 | 15699.34 |
| 10 | MADHYA PRADESH | 49406.18 | 45980.31 | 55724.11 | 38534.69 | 63241.34 | 47132.09 |
| 11 | MAHARASHTRA | 39526.98 | 51439.62 | 49665.28 | 44035.79 | 55055.2 | 50947.2 |
| 12 | ODISHA | 35046.9 | 35630.84 | 35698.64 | 28603.34 | 46408.23 | 32117.23 |
| 13 | PUNJAB | 4978.88 | 16275.01 | 6144.75 | 10965.67 | 7488.18 | 12981.63 |
| 14 | RAJASTHAN | 23535.76 | 31038.94 | 28939.88 | 23913.52 | 33221.84 | 27873.05 |
| 15 | TAMIL NADU | 25535.68 | 28000.3 | 28651.21 | 17790.77 | 37246.57 | 23379.78 |
| 16 | TELANGANA | 18292.97 | 19669.76 | 18076.35 | 14347.47 | 21170.5 | 17816.79 |
| 17 | UTTAR PRADESH | 160784.24 | 90387.95 | 165244.43 | 70772.24 | 156155.99 | 80195.01 |
| 18 | WEST BENGAL | 38485.72 | 55610.05 | 47617.5 | 45755.55 | 54420 | 51081.49 |
| 19 | DELHI | 6740.28 | 11160.11 | 6762.17 | 6278.02 | 6762.17 | 5479.59 |
| 20 | PUDUCHERRY | 3404.04 | 1181.74 | 348.12 | 421.65 | 0 | 447.65 |
| 21 | HIMACHAL PRADESH | 5523.79 | 16407.14 | 5366.32 | 11828.07 | 6976.22 | 18179.26 |
| 22 | JAMMU & KASHMIR | 8070.34 | 26300.45 | 4257.02 | 20305.29 | 4257.02 | 29614 |
| 23 | UTTARAKHAND | 9691.34 | 15442.56 | 11392.44 | 11226.46 | 12090.44 | 17648.3 |
| 24 | A & N ISLANDS | 262.67 | 551.92 | 284.57 | 501.85 | 369.94 | 756.8 |
| 25 | CHANDIGARH | 380.98 | 539.86 | 592.09 | 339.162 | 769.72 | 553.9 |
| 26 | D&NAGAR HAVELI | 203.8 | 365.81 | 129.89 | 186.12 | 168.86 | 300.97 |
| 27 | DAMAN & DIU | 174.12 | 133.84 | 130.83 | 66.373 | 170.08 | 76.45 |
| 28 | LAKSHADWEEP | 68.31 | 481.11 | 77.12 | 76.375 | 100.26 | 169.44 |
| 29 | ARUNACHAL PRADESH | 4239.79 | 8591.49 | 4085.14 | 4184.17 | 5010.68 | 7528.29 |
| 30 | ASSAM | 37818.61 | 49218.48 | 35875.31 | 37084.11 | 45037.9 | 50802.45 |
| 31 | MANIPUR | 3077.49 | 9857.74 | 3914.63 | 6797.25 | 5089.02 | 9709.45 |
| 32 | MEGHALAYA | 8352.22 | 5676.27 | 9422.19 | 3326.62 | 10468.21 | 5613.68 |
| 33 | MIZORAM | 2156.92 | 3164.76 | 2000.25 | 1415.31 | 2242.64 | 2544.32 |
| 34 | NAGALAND | 3490.47 | 3884.45 | 6902.3 | 2214.17 | 7588.35 | 4828.28 |
| 35 | SIKKIM | 585.52 | 1537.34 | 632.47 | 793.03 | 751.11 | 1430 |
| 36 | TRIPURA | 5946.55 | 8579.66 | 6650.22 | 6084.74 | 7488.55 | 8940.65 |
| Total | 702779.63 | 754660.18 | 758527.35 | 577533.88 | 857631.86 | 713971.26 | |
This information was given by the Minister of Women and Child Development, Smriti Zubin Irani, in a written reply in the Rajya Sabha


