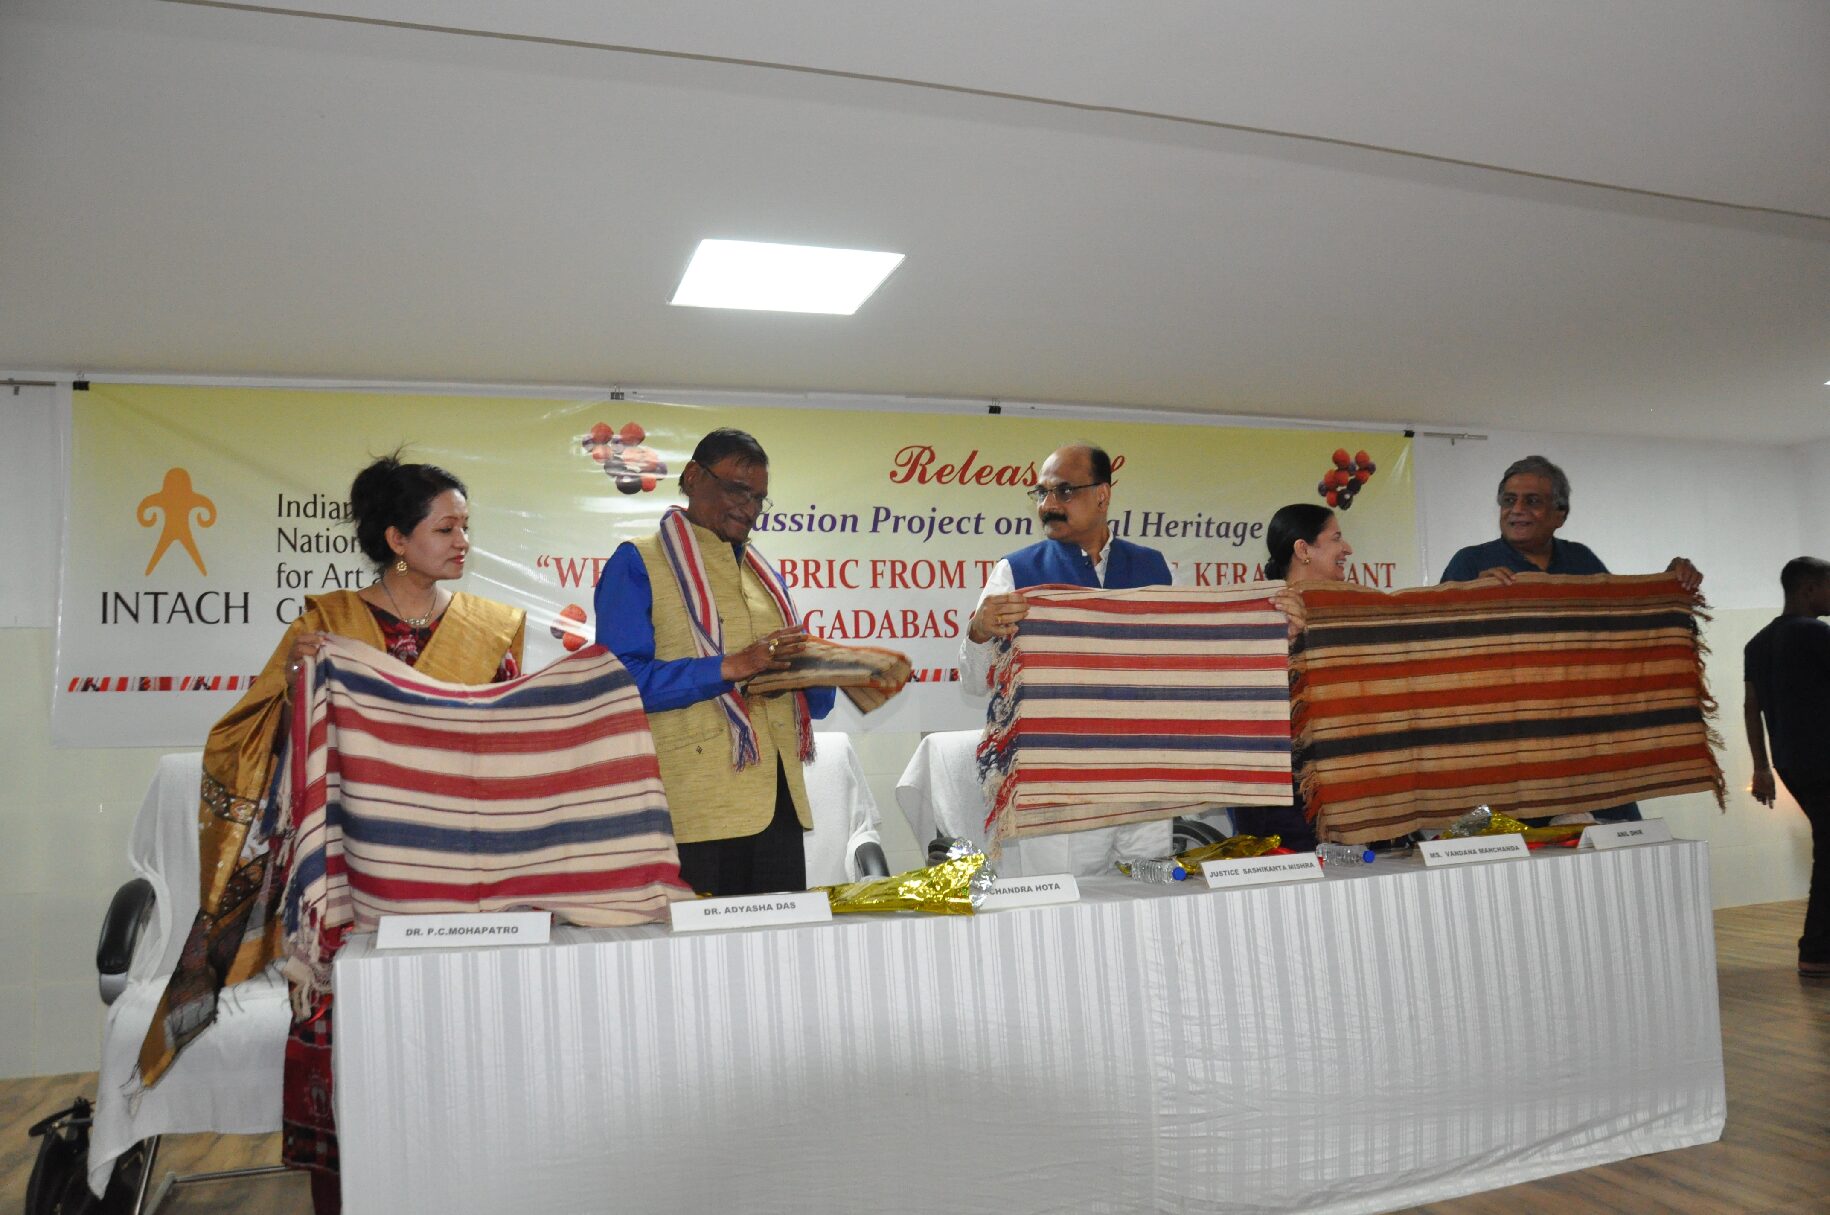
As per Nielsen baseline survey of Powerloom industry conducted during 2012-13, 24.86 lakh Powerloomswereinstalled in the country. The location-wise details is in ANNEXURE-I. As per 4th All India Handloom Census (2019-20), there are 28,23,382 handlooms across the country on which handloom cloth/products are manufactured using varieties of yarn. A statement showing state-wise number of handlooms is at ANNEXURE-II.
The details of funds allocation/expenditure under major schemes in the last three years and till date are atANNEXURE-III.
This information was given in a written reply by the Union Minister of Textiles, Smt. SmritiZubinIrani in LokSabha today.
Annexure-I
Number of Powerlooms across the country
|
STATE |
TOTALLOOMS |
| UP | 190874 |
| RAJASTHAN | 22980 |
| HARYANA | 25510 |
| PUNJAB&HP,J&K | 14511 |
| MP | 39979 |
| NORTHZONETOTAL | 293854 |
| GUJARAT | 524102 |
| MAHARASHTRA | 948891 |
| CHATTISGARH | 166 |
| WESTZONETOTAL | 1473159 |
| ORISSA | 1793 |
| WB | 12690 |
| BIHAR | 20511 |
| ASSAM/NE | 464 |
| EASTZONETOTAL | 35458 |
| TN | 562513 |
| AP | 48176 |
| KARNATAKA | 68795 |
| KERALA | 4463 |
| SOUTHZONETOTAL | 683947 |
| ALLINDIA | 2486418 |
Annexure-II
Annexure-III
Details of Funds allocated and Expenditure under various Textile Sector Schemes
(Rs. in crores)
| Textile Sector | 2017-18 | 2018-19 | 2019-20 | 2020-21 | ||||||||
| Name of the Scheme/ Project/ Programme | BE | RE | Exp | BE | RE | Exp | BE | RE | Exp |
BE |
RE |
Exp. Upto 17.03.21 |
| Handloom | 604 | 470.28 | 468.98 | 396.09 | 400.59 | 334.33 | 456.8 | 445.94 | 385.02 | 475 | 336 | 297.85 |
| Handicrafts | 289.7 | 229.82 | 217.06 | 198.42 | 240.61 | 195.20 | 286.17 | 332.31 | 282.16 | 398.21 | 284.77 | 235.59 |
| Wool | 32 | 25 | 29.14 | 11.45 | 5.3 | 3.3 | 29 | 29 | 16.5 | 20 | 10 | 9.33 |
| Silk | 575 | 600 | 542.5 | 510.61 | 600.61 | 601.29 | 740 | 765.45 | 787.61 | 810 | 650 | 650 |
| Powerloom | 161.76 | 115.5 | 114.91 | 112.15 | 106.18 | 91.90 | 159.08 | 152.78 | 41.53 | 140 | 60 | 49.63 |
| Jute | 97.52 | 135.92 | 149.18 | 28.14 | 28.04 | 28.00 | 34.55 | 84.55 | 104.42 | 136.53 | 71.5 | 54.25 |
| Technology Upgradation Funds Schemes (TUFs) | 2013 | 1956 | 1904.95 | 2300 | 622.63 | 615.68 | 700 | 494.37 | 317.9 |
761.90 |
545 |
502.77 |
| Research & Capacity Building | 272.99 | 153.2 | 151.72 | 252.09 | 93.99 | 50.25 | 142.24 | 182.66 | 149.45 |
327.01 |
195 |
142.68 |
| North Eastern Textiles Promotion | 245 | 245 | 259.8 | 112.6 | 112.6 | 65.71 | 125 | 126.01 | 117.21 |
135.60 |
42.4 |
16.45 |
| Total | 4290.97 | 3930.72 | 3838.24 | 3921.55 | 2210.55 | 1985.66 | 2672.84 | 2613.07 | 2201.80 |
3204.25 |
2194.67 |
1958.55 |


