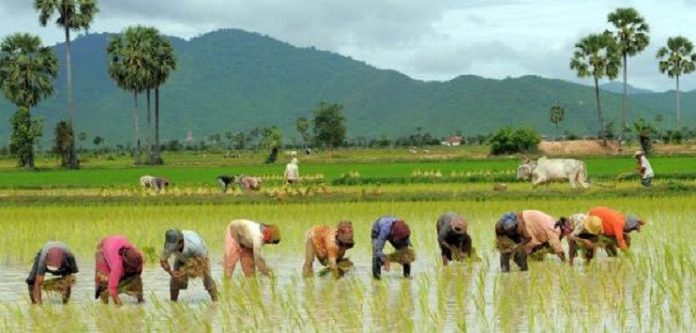
Promotion of exports of agricultural products like basmati rice is a continuous process. The Agricultural & Processed Food Products Export Development Authority (APEDA), an autonomous organisation under the administrative control of Department of Commerce, has been mandated with the export promotion of rice including basmati rice. APEDA has been able to register Basmati Rice as a Geographical Indication (GI) in February 2016. APEDA, in collaboration with the trade, has also established Basmati Export Development Foundation (BEDF), which undertakes various activities for development and export promotion of Basmati rice. Moreover, APEDA has also been providing assistance to the Basmati rice exporters under various components of its export promotion scheme.
No country has imposed a ban on import of basmati rice from India. The quantum and value of rice exported and imported during each of the last three years and the current year, country and variety-wise (basmati and non-basmati) are:
Export of Basmati Rice
Quantity in MT; Value in USD Million
| COUNTRY | 2016-17 | 2017-18 | 2018-19 | 2019-20 (Apr-May) | ||||
| Quantity | Value | Quantity | Value | Quantity | Value | Quantity | Value | |
| IRAN | 716582 | 564.28 | 877420 | 904.73 | 1483697 | 1556.17 | 333079 | 364.09 |
| SAUDI ARAB | 809344 | 671.08 | 792480 | 829.61 | 867741 | 938.91 | 171738 | 183.22 |
| IRAQ | 453741 | 337.32 | 429965 | 435.52 | 385732 | 399.43 | 56760 | 56.95 |
| U ARAB EMTS | 614659 | 467.66 | 429324 | 437.66 | 282375 | 297.62 | 35131 | 39.50 |
| YEMEN REPUBLC | 130652 | 103.28 | 167687 | 161.04 | 201926 | 209.95 | 41352 | 43.06 |
| KUWAIT | 162674 | 149.37 | 166873 | 177.91 | 154745 | 177.11 | 31275 | 32.57 |
| U S A | 108992 | 112.17 | 126792 | 149.01 | 135605 | 168.74 | 25135 | 31.30 |
| U K | 150537 | 101.55 | 180509 | 159.17 | 111924 | 106.08 | 14349 | 13.94 |
| OMAN | 83151 | 75.48 | 78085 | 89.64 | 87832 | 96.61 | 13771 | 15.63 |
| QATAR | 81961 | 72.47 | 81101 | 82.08 | 73569 | 76.08 | 18126 | 18.26 |
| OTHER COUNTRIES | 672917 | 553.92 | 726611 | 743.19 | 629459 | 685.75 | 123312 | 133.68 |
| TOTAL | 3985210 | 3208.60 | 4056847 | 4169.56 | 4414605 | 4712.44 | 864028 | 932.20 |
Export of Non-Basmati Rice
Quantity in MT; Value in USD Million
| COUNTRY | 2016-17 | 2017-18 | 2018-19 | 2019-20 (Apr-May) | ||||
| Quantity | Value | Quantity | Value | Quantity | Value | Quantity | Value | |
| NEPAL | 583737 | 209.73 | 624860 | 240.40 | 770118 | 281.14 | 88905 | 36.00 |
| BENIN | 702183 | 251.87 | 778779 | 314.19 | 699005 | 264.16 | 73372 | 27.33 |
| BANGLADESH PR | 82689 | 29.67 | 2037980 | 835.39 | 480566 | 221.90 | 2550 | 2.28 |
| SENEGAL | 676060 | 189.68 | 833059 | 263.22 | 720475 | 220.83 | 11242 | 4.20 |
| GUINEA | 541573 | 182.44 | 461978 | 173.81 | 467693 | 175.93 | 56369 | 21.04 |
| COTE D’ IVOIRE | 375024 | 124.14 | 398490 | 148.95 | 438089 | 163.17 | 61277 | 22.92 |
| U ARAB EMTS | 260223 | 133.71 | 273773 | 149.21 | 291579 | 147.69 | 27197 | 14.23 |
| SOMALIA | 354677 | 121.66 | 328257 | 125.38 | 326919 | 120.89 | 64678 | 23.68 |
| INDONESIA | 52214 | 18.51 | 39033 | 14.27 | 326005 | 119.22 | 0 | 0.00 |
| LIBERIA | 252381 | 90.97 | 264154 | 100.20 | 301112 | 116.97 | 380 | 0.13 |
| OTHER COUNTRIES | 2890072 | 1172.80 | 2778170 | 1271.57 | 2778188 | 1208.32 | 325867 | 142.01 |
| TOTAL | 6770833 | 2525.19 | 8818533 | 3636.60 | 7599749 | 3040.22 | 711837 | 293.82 |
Import of Non-Basmati Rice
Quantity in MT; Value in USD
| COUNTRY | 2016-17 | 2017-18 | 2018-19 | 2019-20 (Apr-May) | ||||
| Quantity | Value | Quantity | Value | Quantity | Value | Quantity | Value | |
| SUDAN | 0 | 0.00 | 0 | 0.00 | 3316 | 1568803.00 | 0 | 0.00 |
| THAILAND | 402 | 346701.00 | 508 | 483312.00 | 685 | 834602.00 | 170 | 204854.00 |
| SPAIN | 193 | 171059.00 | 575 | 469638.00 | 576 | 486171.00 | 225 | 184778.00 |
| U S A | 356 | 356427.00 | 269 | 270738.00 | 430 | 468700.00 | 169 | 192146.00 |
| ITALY | 139 | 175164.00 | 239 | 359123.00 | 220 | 223463.00 | 2 | 2675.00 |
| OTHER COUNTRIES | 54 | 30952.00 | 531 | 309336.00 | 1644 | 979216.00 | 199 | 122077.00 |
| TOTAL | 1144 | 1080303.00 | 2122 | 1892147.00 | 6871 | 4560955.00 | 765 | 706530.00 |
There are no imports of Basmati Rice Source: DGCI&S
This information was given by the Minister of Commerce and Industry, PiyushGoyal, in a written reply in the Lok Sabha today.


