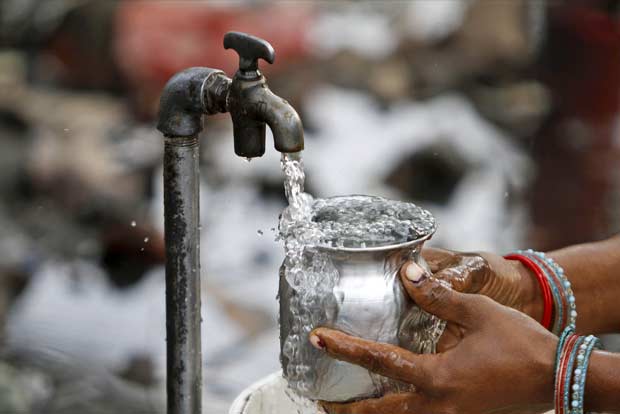
Since August, 2019, Government of India in partnership with States is implementing Jal Jeevan Mission (JJM) after subsuming erstwhile National Rural Drinking Water Programme (NRDWP), to make provision of potable water at the service level of 55 litre per capita per day (lpcd) to every rural household through tap water connection, by 2024. At the time of announcement of Jal Jeevan Mission, out of 18.93 Crore rural households, 3.23 Crore (17%) households were reported to have tap water connections. So far, 5.67 Crore (29.2%) rural households have been provided with tap water connections in last 29 months. Thus, as of date, out of 19.28 Crore rural households in the country, 8.90 Crore (46.2%) households are reported to have tap water supply in their homes. The State/ UT-wise status of tap water connection in rural households across the country is at Annex-I.
Further, as reported by States/ UTs, as on 31.01.2022, out of 17.01 lakh rural habitations of the country, 13.22 lakh (77.67%) habitations having 77.90% population have provision of potable drinking water with supply level of more than 40 litre per capita per day (lpcd) and 3.44 lakh (20.24%) habitations having 20.39% population with supply level of less than 40 lpcd with sources at a reasonable distance and 0.35 lakh (2.08%) rural habitations having 1.71% population are reported to have water quality issues in drinking water sources.
Number of steps have been taken to plan and implement JJM in the whole country with speed, inter alia, which includes joint discussion and finalization of saturation plan and annual action plan (AAP) of States/ UTs, regular review of implementation, workshops/ conferences/ webinars for capacity building, training, knowledge sharing, field visits by multi-disciplinary team to provide technical support, etc. Detailed Operational Guideline for the implementation of JJM; Margdarshika for Gram Panchayats & VWSCs to provide safe drinking water in rural households and Guidelines on a special campaign to provide piped water supply in anganwadi centres, ashramshalas and schools have been shared with States/ UTs, to facilitate planning and implementation of Jal Jeevan Mission. For online monitoring, JJM–Integrated Management Information System (IMIS) and JJM–Dashboard has been put in place. Provision has also been made for transparent online financial management through Public Financial Management System (PFMS).
The State/ UT-wise details of budgetary allocation, fund drawn & reported utilization by States/ UTs under erstwhile NRDWP for 2018-19 and under JJM for 2019-20, 2020-21 and 2021-22 (as on 31.01.2022) is at Annex-II.
This Information was given by the Minister of State for Jal Shakti, Shri Prahlad Singh Patel in a written reply in Lok Sabha today.
Annex-I
State/ UT-wise status of tap water connections in rural households
(as on 31.01.2022)
(Number in lakhs)
| S. No. | State/ UT | Total rural HHs as on 15.08.2019 | Rural HHs with tap water connection as on 15.8.2019 | Total rural HHs as on date | Rural HHs provided with tap water connection as on date from Aug, 2019 | Rural HHs with tap water supply | |||
| No. | In % | No. | In % | No. | In% | ||||
| 1. | A & N Islands | 0.65 | 0.29 | 43.92 | 0.62 | 0.33 | 53.98 | 0.62 | 100.00 |
| 2. | Andhra Pr. | 95.66 | 30.74 | 32.14 | 95.17 | 18.55 | 19.50 | 49.30 | 51.80 |
| 3. | Arunachal Pr. | 2.18 | 0.23 | 10.46 | 2.20 | 0.92 | 41.60 | 1.14 | 51.95 |
| 4. | Assam | 63.35 | 1.11 | 1.76 | 63.35 | 18.07 | 28.52 | 19.18 | 30.28 |
| 5. | Bihar | 183.54 | 3.16 | 1.72 | 1,72.21 | 1,50.58 | 87.44 | 153.74 | 89.28 |
| 6. | Chhattisgarh | 45.48 | 3.20 | 7.03 | 48.59 | 4.97 | 10.23 | 8.17 | 16.81 |
| 7. | DNH and D&D | 0.6 | 0.00 | 0.00 | 0.85 | 0.85 | 100.00 | 0.85 | 100.00 |
| 8. | Goa | 2.63 | 1.99 | 75.70 | 2.63 | 0.64 | 24.30 | 2.63 | 100.00 |
| 9. | Gujarat | 93.03 | 65.16 | 70.04 | 91.77 | 18.27 | 19.91 | 83.44 | 90.92 |
| 10. | Haryana | 28.94 | 17.66 | 61.04 | 30.97 | 13.30 | 42.96 | 30.97 | 100.00 |
| 11. | Himachal Pr. | 17.04 | 7.63 | 44.76 | 17.28 | 8.27 | 47.88 | 15.90 | 92.03 |
| 12. | J&K | 18.17 | 5.75 | 31.67 | 18.35 | 4.73 | 25.76 | 10.48 | 57.12 |
| 13. | Jharkhand | 54.09 | 3.45 | 6.38 | 59.23 | 7.33 | 12.37 | 10.78 | 18.20 |
| 14. | Karnataka | 89.61 | 24.51 | 27.35 | 97.92 | 20.44 | 20.88 | 44.96 | 45.91 |
| 15. | Kerala | 67.15 | 16.64 | 24.78 | 70.69 | 10.25 | 14.49 | 26.89 | 38.04 |
| 16. | Ladakh | 0.44 | 0.01 | 3.21 | 0.43 | 0.11 | 26.11 | 0.13 | 29.42 |
| 17. | Madhya Pr. | 121.24 | 13.53 | 11.16 | 122.28 | 32.55 | 26.62 | 46.08 | 37.68 |
| 18. | Maharashtra | 142.36 | 48.44 | 34.03 | 146.09 | 50.26 | 34.40 | 98.70 | 67.56 |
| 19. | Manipur | 4.52 | 0.26 | 5.73 | 4.52 | 2.58 | 57.12 | 2.84 | 62.86 |
| 20. | Meghalaya | 5.9 | 0.05 | 0.77 | 5.90 | 2.01 | 33.99 | 2.05 | 34.77 |
| 21. | Mizoram | 1.27 | 0.09 | 7.24 | 1.33 | 0.53 | 39.60 | 0.62 | 46.51 |
| 22. | Nagaland | 3.86 | 0.14 | 3.60 | 3.77 | 1.35 | 35.67 | 1.48 | 39.35 |
| 23. | Odisha | 83.06 | 3.11 | 3.74 | 88.34 | 33.57 | 38.01 | 36.68 | 41.52 |
| 24. | Puducherry | 1.15 | 0.94 | 81.31 | 1.15 | 0.21 | 18.63 | 1.15 | 100.00 |
| 25. | Punjab | 35.07 | 16.79 | 47.86 | 34.40 | 17.19 | 49.96 | 33.97 | 98.76 |
| 26. | Rajasthan | 101.32 | 11.74 | 11.59 | 1,01.45 | 11.07 | 10.92 | 22.82 | 22.49 |
| 27. | Sikkim | 1.05 | 0.70 | 67.00 | 1.05 | 0.13 | 12.31 | 0.83 | 79.26 |
| 28. | Tamil Nadu | 126.89 | 21.76 | 17.15 | 1,26.89 | 29.30 | 23.09 | 51.06 | 40.24 |
| 29. | Telangana | 54.38 | 15.68 | 28.84 | 54.06 | 38.38 | 70.99 | 54.06 | 100.00 |
| 30. | Tripura | 8.01 | 0.25 | 3.06 | 7.60 | 2.84 | 37.35 | 3.08 | 40.57 |
| 31. | Uttar Pr. | 263.39 | 5.16 | 1.96 | 2,64.28 | 29.98 | 11.34 | 35.14 | 13.30 |
| 32. | Uttarakhand | 14.62 | 1.30 | 8.91 | 15.18 | 6.51 | 42.89 | 7.81 | 51.48 |
| 33. | West Bengal | 163.26 | 2.15 | 1.31 | 1,77.23 | 30.66 | 17.30 | 32.81 | 18.51 |
| Total | 18,93.91 | 3,23.62 | 17.07 | 19,27.76 | 5,66.74 | 29.40 | 8,90.36 | 46.19 | |
Source: JJM – IMIS HH: Households
Annex-II
National Rural Drinking Water Programme (NRDWP): Central fund allocated, drawn and reported utilization in 2018-19
(Amount in Rs. Crore)
| S. No. | State/ UT | Central share | Expenditure under State share | ||||
| Opening Balance | Fund allocated | Fund drawn | Available fund | Reported utilization | |||
|
|
A & N Islands | 1.05 | 0.62 | 0.31 | 1.36 | 1.36 | 4.85 |
|
|
Andhra Pr. | 26.17 | 197.56 | 185.85 | 212.02 | 186.28 | 167.61 |
|
|
Arunachal Pr. | 12.54 | 96.95 | 90.89 | 103.43 | 97.21 | 13.25 |
|
|
Assam | 394.85 | 567.89 | 300.76 | 695.61 | 336.25 | 26.68 |
|
|
Bihar | 226.79 | 476.63 | 234.84 | 461.63 | 148.48 | 211.30 |
|
|
Chhattisgarh | 26.81 | 95.47 | 48.19 | 75.00 | 43.41 | 36.62 |
|
|
Goa | 1.40 | 3.34 | 1.67 | 3.07 | 3.07 | 2.83 |
|
|
Gujarat | 1.15 | 237.09 | 222.27 | 223.42 | 223.42 | 495.41 |
|
|
Haryana | 29.86 | 81.88 | 76.76 | 104.61 | 94.48 | 93.18 |
|
|
Himachal Pr. | 0.01 | 91.12 | 85.43 | 85.44 | 85.43 | 24.17 |
|
|
Jammu & Kashmir | 37.78 | 309.07 | 249.34 | 287.12 | 251.88 | 19.63 |
|
|
Jharkhand | 126.15 | 207.97 | 85.12 | 212.51 | 136.73 | 100.93 |
|
|
Karnataka | 184.50 | 331.04 | 276.06 | 460.56 | 433.95 | 798.62 |
|
|
Kerala | 2.34 | 90.37 | 84.86 | 87.20 | 84.62 | 83.48 |
|
|
Madhya Pr. | 8.08 | 274.09 | 243.62 | 251.70 | 250.43 | 306.29 |
|
|
Maharashtra | 267.46 | 474.16 | 239.06 | 506.52 | 258.40 | 395.86 |
|
|
Manipur | 27.37 | 40.25 | 37.73 | 65.10 | 65.11 | 7.86 |
|
|
Meghalaya | 0.35 | 52.43 | 49.15 | 49.50 | 48.71 | 5.23 |
|
|
Mizoram | 20.31 | 28.00 | 26.25 | 46.59 | 46.46 | 5.12 |
|
|
Nagaland | 0.00 | 34.72 | 17.36 | 17.36 | 17.36 | 2.49 |
|
|
Odisha | 42.86 | 154.99 | 128.82 | 173.23 | 172.45 | 221.92 |
|
|
Puducherry | 1.27 | 1.29 | ND | 1.27 | NR | NR |
|
|
Punjab | 96.28 | 125.97 | 119.41 | 215.69 | 112.78 | 106.29 |
|
|
Rajasthan | 536.75 | 692.13 | 655.41 | 1,192.16 | 878.48 | 887.05 |
|
|
Sikkim | 10.85 | 11.62 | 10.89 | 21.89 | 21.06 | 4.02 |
|
|
Tamil Nadu | 0.68 | 180.99 | 167.31 | 170.41 | 168.92 | 363.02 |
|
|
Telangana | 294.30 | 131.40 | 123.18 | 425.37 | 420.90 | 294.23 |
|
|
Tripura | 48.58 | 55.18 | 51.73 | 102.82 | 53.88 | 7.98 |
|
|
Uttar Pr. | 113.65 | 713.95 | 670.72 | 813.40 | 755.08 | 604.49 |
|
|
Uttarakhand | 5.00 | 99.17 | 92.97 | 97.97 | 91.85 | 32.91 |
|
|
West Bengal | 418.02 | 917.82 | 890.28 | 1,308.30 | 547.47 | 362.38 |
Source: JJM – IMIS ND: Not Drawn NR: Not Reported
Jal Jeevan Mission: Central fund allocated, drawn and reported utilization in 2019-20
(Amount in Rs. Crore)
| S. No. | State/ UT | Central share | Expenditure under State share | ||||
| Opening Balance | Fund allocated | Fund drawn | Available fund | Reported utilization | |||
|
|
A & N Islands | 0.00 | 1.78 | 0.50 | 0.50 | NR | NR |
|
|
Andhra Pr. | 25.74 | 372.64 | 372.64 | 398.38 | 121.62 | 54.80 |
|
|
Arunachal Pr. | 6.22 | 132.55 | 177.47 | 183.69 | 126.14 | 13.35 |
|
|
Assam | 359.35 | 694.95 | 442.36 | 801.71 | 358.87 | 29.01 |
|
|
Bihar | 313.16 | 787.31 | 417.35 | 730.51 | 473.33 | 150.34 |
|
|
Chhattisgarh | 31.58 | 208.04 | 65.82 | 97.40 | 39.23 | 37.55 |
|
|
Goa | 0.00 | 7.57 | 3.08 | 3.08 | 3.08 | 6.17 |
|
|
Gujarat | 0.00 | 390.31 | 390.31 | 390.31 | 384.61 | 394.74 |
|
|
Haryana | 10.13 | 149.95 | 149.95 | 160.08 | 69.29 | 73.80 |
|
|
Himachal Pr. | 0.00 | 148.67 | 205.83 | 205.83 | 197.87 | 15.46 |
|
|
Jammu & Kashmir | 27.14 | 322.03 | 322.03 | 349.17 | 200.25 | 24.01 |
|
|
Jharkhand | 75.79 | 267.69 | 291.19 | 366.98 | 114.58 | 119.71 |
|
|
Karnataka | 26.61 | 546.06 | 546.06 | 572.67 | 492.24 | 297.87 |
|
|
Kerala | 2.58 | 248.76 | 101.29 | 103.87 | 62.69 | 57.23 |
|
|
Ladakh | 8.10 | 166.65 | 67.86 | 75.96 | NR | 0.65 |
|
|
Madhya Pr. | 1.26 | 571.60 | 571.60 | 572.86 | 326.65 | 288.75 |
|
|
Maharashtra | 248.12 | 847.97 | 345.28 | 593.40 | 308.04 | 428.14 |
|
|
Manipur | 0.00 | 67.69 | 91.17 | 91.17 | 28.20 | 6.60 |
|
|
Meghalaya | 0.80 | 86.02 | 43.01 | 43.81 | 26.35 | 0.77 |
|
|
Mizoram | 0.14 | 39.87 | 68.05 | 68.19 | 37.41 | 1.81 |
|
|
Nagaland | 0.00 | 56.49 | 56.49 | 56.49 | 23.54 | 4.67 |
|
|
Odisha | 0.78 | 364.74 | 364.74 | 365.52 | 275.02 | 255.02 |
|
|
Puducherry | 1.27 | 2.50 | ND | 1.27 | 0.97 | NR |
|
|
Punjab | 102.91 | 227.46 | 227.46 | 330.37 | 73.27 | 78.20 |
|
|
Rajasthan | 313.67 | 1,301.71 | 1,301.71 | 1,615.38 | 620.31 | 698.54 |
|
|
Sikkim | 0.84 | 15.41 | 26.15 | 26.99 | 14.71 | 1.48 |
|
|
Tamil Nadu | 1.49 | 373.87 | 373.10 | 374.59 | 114.58 | 99.14 |
|
|
Telangana | 4.48 | 259.14 | 105.52 | 110.00 | 88.33 | 74.46 |
|
|
Tripura | 48.94 | 107.64 | 145.37 | 194.31 | 59.45 | 6.46 |
|
|
Uttar Pr. | 58.33 | 1,206.28 | 1,513.14 | 1,571.47 | 639.32 | 380.10 |
|
|
Uttarakhand | 6.12 | 170.53 | 170.53 | 176.65 | 110.04 | 23.02 |
|
|
West Bengal | 760.82 | 995.33 | 994.75 | 1,755.57 | 609.00 | 445.03 |
Source: JJM – IMIS ND: Not Drawn NR: Not ReportedJal Jeevan Mission:
Central fund allocated, drawn and reported utilization in 2020-21
(Amount in Rs. Crore)
| S. No. | State/ UT | Central share | Expenditure under State share | ||||
| Opening Balance | Fund allocated | Fund drawn | Available fund | Reported utilization | |||
|
|
A & N Islands | 0.50 | 2.93 | 1.46 | 1.96 | 1.45 | NR |
|
|
Andhra Pr. | 276.76 | 790.48 | 297.62 | 574.38 | 427.73 | 180.97 |
|
|
Arunachal Pr. | 57.56 | 254.85 | 344.85 | 402.41 | 392.43 | 32.05 |
|
|
Assam | 452.45 | 1,608.51 | 551.77 | 1,004.22 | 880.44 | 90.02 |
|
|
Bihar | 257.18 | 1,839.16 | 353.6 | 610.78 | 551.82 | 374.42 |
|
|
Chhattisgarh | 58.17 | 445.52 | 334.14 | 392.31 | 223.8 | 221.1 |
|
|
Goa | 0.00 | 12.41 | 6.2 | 6.2 | 2.99 | 13.49 |
|
|
Gujarat | 5.7 | 883.08 | 983.08 | 988.78 | 838.5 | 883.43 |
|
|
Haryana | 90.8 | 289.52 | 72.38 | 163.18 | 130.94 | 120.17 |
|
|
Himachal Pr. | 7.95 | 326.2 | 547.48 | 555.43 | 329.01 | 42.25 |
|
|
Jammu & Kashmir | 148.92 | 681.77 | 53.72 | 202.64 | 88.69 | 5.17 |
|
|
Jharkhand | 268.39 | 572.24 | 143.06 | 411.45 | 286.62 | 177.73 |
|
|
Karnataka | 80.42 | 1,189.40 | 446.36 | 526.78 | 349.62 | 416.38 |
|
|
Kerala | 41.18 | 404.24 | 303.18 | 344.36 | 304.29 | 311.25 |
|
|
Ladakh | 75.96 | 352.09 | ND | 75.96 | 9.43 | NR |
|
|
Madhya Pr. | 246.21 | 1,280.13 | 960.09 | 1,206.3 | 1,014.70 | 875.99 |
|
|
Maharashtra | 285.35 | 1,828.92 | 457.23 | 742.58 | 473.59 | 324.16 |
|
|
Manipur | 62.96 | 131.8 | 141.8 | 204.76 | 189.14 | 18.52 |
|
|
Meghalaya | 17.46 | 174.92 | 184.92 | 202.38 | 188.3 | 20.44 |
|
|
Mizoram | 30.77 | 79.3 | 104.3 | 135.07 | 107.9 | 10.13 |
|
|
Nagaland | 34.9 | 114.09 | 85.57 | 120.47 | 91.95 | 10.0 |
|
|
Odisha | 90.5 | 812.15 | 609.11 | 699.61 | 688.69 | 673 |
|
|
Puducherry | 0.3 | 4.64 | 1.06 | 1.36 | 0.2 | 1.0 |
|
|
Punjab | 257.1 | 362.79 | ND | 257.1 | 146.74 | 104.95 |
|
|
Rajasthan | 995.07 | 2,522.03 | 630.51 | 1,625.58 | 762.04 | 789.05 |
|
|
Sikkim | 12.3 | 31.36 | 39.36 | 51.66 | 43.43 | 3.75 |
|
|
Tamil Nadu | 264.09 | 921.99 | 690.36 | 954.45 | 576.97 | 399.57 |
|
|
Telangana | 31.1 | 412.19 | 82.71 | 113.81 | 61.17 | 133.98 |
|
|
Tripura | 136.46 | 156.61 | 117.46 | 253.92 | 195 | 22.26 |
|
|
Uttar Pr. | 932.16 | 2,570.94 | 1,295.47 | 2,227.63 | 1,761.06 | 886.94 |
|
|
Uttarakhand | 66.6 | 362.58 | 271.93 | 338.53 | 227.32 | 20.02 |
|
|
West Bengal | 1,146.58 | 1,614.18 | 807.08 | 1,953.66 | 1,196.07 | 641.17 |
Source: JJM – IMIS ND: Not Drawn NR: Not Report
Jal Jeevan Mission: Central fund allocated, drawn and reported utilization in 2021-22
(as on 31.01.2022)
(Amount in Rs. Crore)
| S. No. | State/ UT | Central share | Expenditure under State share | ||||
| Opening Balance | Fund allocated | Fund drawn | Available fund | Reported utilization | |||
|
|
A & N Islands | 0.52 | 8.26 | 2.06 | 2.58 | 0.83 | NR |
|
|
Andhra Pr. | 146.65 | 3,182.88 | 791.06 | 937.71 | 47.73 | 39.93 |
|
|
Arunachal Pr. | 9.98 | 1,013.53 | 760.15 | 770.13 | 359.80 | 33.50 |
|
|
Assam | 123.78 | 5,601.16 | 2,800.58 | 2,932.66 | 1,441.65 | 155.99 |
|
|
Bihar | 58.95 | 6,608.25 | ND | 58.95 | 2.41 | 173.92 |
|
|
Chhattisgarh | 168.52 | 1,908.96 | 453.71 | 625.38 | 285.84 | 282.40 |
|
|
Goa | 3.21 | 45.53 | 11.38 | 14.59 | 11.80 | 11.80 |
|
|
Gujarat | 150.28 | 3,410.61 | 2,557.96 | 2,708.24 | 1,521.88 | 1,521.40 |
|
|
Haryana | 32.24 | 1,119.95 | 279.99 | 312.23 | 251.95 | 245.89 |
|
|
Himachal Pr. | 226.42 | 1,262.78 | 1,262.78 | 1,489.20 | 1,022.47 | 108.62 |
|
|
Jammu & Kashmir | 113.96 | 2,747.17 | 604.18 | 718.14 | 45.42 | NR |
|
|
Jharkhand | 137.93 | 2,479.88 | 512.22 | 650.15 | 151.98 | 227.11 |
|
|
Karnataka | 177.16 | 5,008.80 | 1,252.20 | 1,429.36 | 910.48 | 743.27 |
|
|
Kerala | 40.07 | 1,804.59 | 1,353.44 | 1,394.17 | 618.78 | 683.71 |
|
|
Ladakh | 66.52 | 1,429.96 | 340.68 | 407.20 | 41.65 | NR |
|
|
Madhya Pr. | 191.61 | 5,116.79 | 2,558.39 | 2,750.00 | 1,574.82 | 1,590.11 |
|
|
Maharashtra | 268.99 | 7,064.41 | 1,666.64 | 1,935.63 | 207.83 | 267.84 |
|
|
Manipur | 15.62 | 481.19 | 360.89 | 376.51 | 355.80 | 40.27 |
|
|
Meghalaya | 15.06 | 678.39 | 508.79 | 523.85 | 402.42 | 43.64 |
|
|
Mizoram | 27.17 | 303.89 | 151.94 | 179.11 | 96.65 | 12.46 |
|
|
Nagaland | 28.52 | 444.81 | 222.41 | 250.93 | 135.60 | 15.53 |
|
|
Odisha | 10.93 | 3,323.42 | 1,661.71 | 1,672.64 | 789.10 | 781.71 |
|
|
Puducherry | 1.18 | 30.22 | 7.47 | 8.66 | 0.99 | NR |
|
|
Punjab | 110.36 | 1,656.39 | 402.24 | 512.60 | 148.02 | 117.38 |
|
|
Rajasthan | 863.53 | 10,180.50 | 2,345.08 | 3,208.61 | 442.31 | 525.37 |
|
|
Sikkim | 8.29 | 124.79 | 93.59 | 101.88 | 52.08 | 4.84 |
|
|
Tamil Nadu | 377.48 | 3,691.21 | 614.35 | 998.83 | 285.24 | 307.44 |
|
|
Telangana | 55.15 | 1,653.09 | ND | 55.15 | 8.84 | 30.06 |
|
|
Tripura | 61.51 | 614.09 | 460.57 | 522.08 | 379.38 | 47.08 |
|
|
Uttar Pr. | 466.56 | 10,870.50 | 2,398.62 | 2,865.18 | 2,351.37 | 1,305.84 |
|
|
Uttarakhand | 111.22 | 1,443.80 | 721.90 | 833.12 | 412.17 | 46.44 |
|
|
West Bengal | 757.58 | 6,998.97 | 1,404.61 | 2,162.19 | 458.79 | 278.20 |
Source: JJM- IMIS ND: Not Drawn NR: Not Reported


