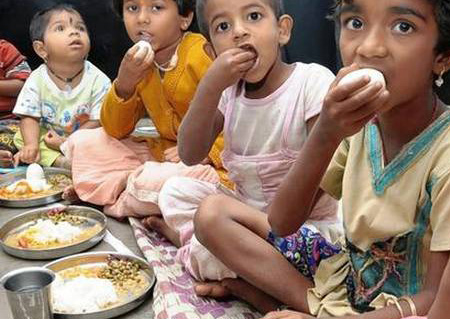
As per the report of National Family Health Survey (NFHS) – 4 conducted by Ministry of Health and Family Welfare in 2015-16, 35.7% children under 5 years of age are underweight, 38.4% are stunted and 58.5% are anemic. Further, 22.9% women (15-49 years of age) have chronic energy deficiency (BMI less than 18.5) and 53% are anemic.
The Government has accorded high priority to the issue of malnutrition and is implementing several schemes/programmes of different Ministries/Departments through States/UTs to address various aspects related to nutrition. This Ministry is implementing POSHAN Abhiyaan, Pradhan MantriMatruVandanaYojana, Anganwadi Services and Scheme for Adolescent Girlsunder the Umbrella Integrated Child Development Services Scheme as direct targeted interventions to address the problem of malnutrition in the country.
UN agencies provide technical support to the Government to prevent and reduce malnutrition among women and children. No financial assistance has been received from United Nations or UNESCO.
The monitoring systems in-built in the schemes are as under:
- NITI Aayog undertakes periodic monitoring and evaluation of POSHAN Abhiyaan through their ‘Technical Unit’ for assessing the impact of the programme. In order to ensure regular monitoring and review of all sectoral programmes under POSHAN Abhiyaan, a National Nutrition Resource Centre – Central Project Monitoring Unit (NNRC–CPMU) has been constituted.
- The Pradhan MantriMatruVandanaYojana is implemented through web based Management and Information (MIS) Software, viz., Pradhan MantriMatruVandanaYojana-Common Application Software (PMMVY-CAS) which is used as an effective tool for regular monitoring.
- The Anganwadi Services Scheme has an in-built monitoring system since its inception to track the physical progress of the scheme in respect of various input process, output and impact indicators through a standardized Management Information System (MIS).Further, in order to strengthen the performance of Anganwadi Services, Government has introduced monitoring and review mechanism at different levels (National/ State/ District/ Block and Anganwadi level).
Under the Scheme for Adolescent Girls, monitoring committees have been set up at all levels (National, State, District, Block and Village level) to take stock of the progress of the scheme as also to strengthen the coordination and convergence between concerned departments.The details of amount released during the last three years and current year under these schemes is at Annexure I, II, III and IV.
Annexure-I
Status of Fund Release under POSHAN Abhiyaan in years 2017-18, 2018-19 and 2019-20
(₹ in lakhs)
| S. No. | State/UT | Release in FY 2017-18 | Release in FY 2018-19 | Release in FY 2019-20 |
| 1 | Andhra Pradesh | 1284.63 | 8604.68 | – |
| 2 | Arunachal Pradesh | 52.93 | 2663.35 | – |
| 3 | Assam | 2298.27 | 15492.36 | – |
| 4 | Bihar | 6724.06 | 15001.67 | – |
| 5 | Chhattisgarh | 965.45 | 9629.51 | – |
| 6 | Delhi | 945.95 | 2206.88 | – |
| 7 | Goa | 238.07 | 197.78 | – |
| 8 | Gujarat | 3036.66 | 11228.04 | – |
| 9 | Haryana | 400.97 | 5992.46 | – |
| 10 | Himachal Pradesh | 1557.26 | 4153.15 | – |
| 11 | Jammu & Kashmir | 388.59 | 8343.52 | – |
| 12 | Jharkhand | 1555.35 | 5110.45 | – |
| 13 | Karnataka | 3351.05 | 9870.89 | – |
| 14 | Kerala | 1273.37 | 6491.91 | – |
| 15 | Madhya Pradesh | 3441.49 | 15894.17 | – |
| 16 | Maharashtra | 2572.31 | 20989.28 | – |
| 17 | Manipur | 340.46 | 3865.37 | – |
| 18 | Meghalaya | 462.98 | 1713.27 | – |
| 19 | Mizoram | 119.38 | 957.65 | – |
| 20 | Nagaland | 163.74 | 1251.97 | – |
| 21 | Odisha | 4600.46 | 10571.65 | – |
| 22 | Puducherry | 39.24 | 393.70 | – |
| 23 | Punjab | 819.51 | 6090.33 | – |
| 24 | Rajasthan | 2045.73 | 9680.99 | – |
| 25 | Sikkim | 98.59 | 328.47 | – |
| 26 | Tamil Nadu | 1340.51 | 12210.93 | – |
| 27 | Telangana | 1736.94 | 8595.70 | – |
| 28 | Tripura | 277.91 | 3695.72 | – |
| 29 | Uttar Pradesh | 8440.60 | 29582.87 | – |
| 30 | Uttarakhand | 1866.25 | 4301.57 | – |
| 31 | West Bengal | 5545.27 | 19294.11 | – |
| 32 | Andaman & Nicobar | 100.22 | 416.89 | 307.62 |
| 33 | Chandigarh | 158.88 | 306.82 | 173.97 |
| 34 | Dadra & Nagar Haveli | 108.83 | 129.32 | 114.16 |
| 35 | Daman & Diu | 42.06 | 197.66 | 131.98 |
| 36 | Lakshadweep | 60.00 | 138.90 | 126.75 |
| TOTAL | 58453.97 | 255593.99 | 854.48 |
Note: POSHAN Abhiyaan has been set up on 18.12.2017.
Annexure-II
Status of Fund Release under Pradhan MantriMatruVandanaYojana in years 2017-18, 2018-19 and 2019-20
(Rs. In Lakh)
| S.No | State/UTs | 2017-18 | 2018-19 | 2019-20
(As on 18.06.2019) |
| 1 | A & N Islands | 163.08 | 41.13 | 45.75 |
| 2 | Andhra Pradesh | 7022.36 | 14101.75 | 0 |
| 3 | Arunachal Pradesh | 912.83 | 36 | 0 |
| 4 | Assam | 10448.26 | 817 | 0 |
| 5 | Bihar | 17351.38 | 1253 | 0 |
| 6 | Chandigarh | 290.41 | 248.08 | 56.33 |
| 7 | Chhattisgarh | 4382.58 | 2025.85 | 0 |
| 8 | Dadra & Nagar Haveli | 102.62 | 75.85 | 0 |
| 9 | Daman & Diu | 61.56 | 28.98 | 0 |
| 10 | Goa | 168.85 | 107.26 | 0 |
| 11 | Gujarat | 10186.87 | 5958.97 | 0 |
| 12 | Haryana | 4324.3 | 3674.84 | 0 |
| 13 | Himachal Pradesh | 1821.64 | 1793.84 | 329.74 |
| 14 | Jammu & Kashmir | 3137.84 | 828.42 | 0 |
| 15 | Jharkhand | 5622.7 | 1453.37 | 0 |
| 16 | Karnataka | 10248.81 | 6361.72 | 214.2 |
| 17 | Kerala | 5536.64 | 3514.27 | 0 |
| 18 | Lakshadweep | 27.82 | 4.44 | 0 |
| 19 | Madhya Pradesh | 12320.53 | 18581.47 | 0 |
| 20 | Maharashtra | 12821.1 | 11795.62 | 0 |
| 21 | Manipur | 1474.07 | 75 | 0 |
| 22 | Meghalaya | 1110.83 | 102 | 0 |
| 23 | Mizoram | 710.78 | 294.7 | 0 |
| 24 | Nagaland | 1035.06 | 52 | 0 |
| 25 | NCT Of Delhi | 2008.9 | 795.75 | 0 |
| 26 | Orissa | 7143.33 | 383 | 0 |
| 27 | Puducherry | 331.68 | 63.53 | 0 |
| 28 | Punjab | 4648.73 | 1141.42 | 888.42 |
| 29 | Rajasthan | 11486.97 | 9605.43 | 0 |
| 30 | Sikkim | 354.33 | 21 | 0 |
| 31 | Tamil Nadu | 12087.85 | 658 | 0 |
| 32 | Telangana | 7196.4 | 385 | 0 |
| 33 | Tripura | 1845.49 | 96 | 0 |
| 34 | Uttar Pradesh | 33616.64 | 14216.71 | 430.05 |
| 35 | Uttarakhand | 2610.99 | 1425.66 | 0 |
| 36 | West Bengal | 10245.03 | 2938.72 | 0 |
| Total | 204859.26 | 104955.77 | 1964.49 | |
Note: Scheme implemented across the country with effect from 01.01.2017
Annexure-III
State/UT-wise Funds released in Supplementary Nutrition component of the Anganwadi Services Scheme during last 3 years and current year
(₹ in lakhs)
| S. No. | State/UTs | 2016-17 | 2017-18 | 2018-19 | 2019-20
(As on 15.06.2019) |
| 1 | ANDHRA PRADESH | 31467.53 | 31596.87 | 37353.55 | 11948.05 |
| 2 | BIHAR | 52520.17 | 53741.97 | 76987.83 | 25941.76 |
| 3 | CHHATTISGARH | 22461.93 | 25724.9 | 24279.95 | 9936.6 |
| 4 | GOA | 591.45 | 1011.2 | 859.5 | 281.82 |
| 5 | GUJARAT | 36162.61 | 38496.97 | 32051.56 | 11929.8 |
| 6 | HARYANA | 7131.04 | 3945.75 | 7305.22 | 2803.38 |
| 7 | JHARKHAND | 28723.1 | 25347.42 | 29083.25 | 10663.86 |
| 8 | KARNATAKA | 33914.94 | 56009.24 | 43588.97 | 18182.71 |
| 9 | KERALA | 8305.96 | 10976.6 | 10785.38 | 3954.43 |
| 10 | MADHYA PRADESH | 55779.33 | 66775.88 | 64088.78 | 23188.49 |
| 11 | MAHARASHTRA | 32053.19 | 41445.78 | 106535.22 | 20186.91 |
| 12 | ODISHA | 25519.58 | 47316.24 | 43450.56 | 17016.35 |
| 13 | PUNJAB | 3124.57 | 5282.25 | 3744.1 | 2745.67 |
| 14 | RAJASTHAN | 33045.65 | 34931.86 | 34950.74 | 12181.34 |
| 15 | TAMIL NADU | 26017.9 | 33186.7 | 37271.35 | 13110.55 |
| 16 | TELANGANA | 17418.86 | 18130.74 | 22045.61 | 7762.52 |
| 17 | UTTAR PRADESH | 160784.24 | 129353.52 | 104579.08 | 57257.2 |
| 18 | WEST BENGAL | 30462.46 | 67697.94 | 68046.87 | 19954 |
| 19 | DELHI | 7551.09 | 4051.41 | 3474.65 | 2479.46 |
| 20 | PUDUCHERRY | 1702.02 | 851.02 | 0 | 0 |
| 21 | HIMACHAL PRADESH | 4662.06 | 5795.63 | 6976.21 | 2557.95 |
| 22 | JAMMU & KASHMIR | 4035.18 | 4035.17 | 2128.5 | 1560.91 |
| 23 | UTTARAKHAND | 4649.44 | 15212.13 | 13612.57 | 4433.16 |
| 24 | A & N ISLANDS | 262.68 | 284.57 | 369.94 | 135.65 |
| 25 | CHANDIGARH | 190.49 | 592.09 | 769.72 | 282.23 |
| 26 | D&NAGAR HAVELI | 203.8 | 129.89 | 168.86 | 61.91 |
| 27 | DAMAN & DIU | 174.12 | 130.83 | 170.08 | 62.36 |
| 28 | LAKSHADWEEP | 68.32 | 85.35 | 100.26 | 36.76 |
| 29 | ARUNACHAL PRADESH | 4052.72 | 4035.02 | 4411.4 | 1276.89 |
| 30 | ASSAM | 17921.03 | 31554.71 | 30597.01 | 16513.9 |
| 31 | MANIPUR | 500 | 5244.2 | 7134.08 | 3320.15 |
| 32 | MEGHALAYA | 11184.72 | 12238.89 | 12364.04 | 3838.34 |
| 33 | MIZORAM | 2156.92 | 1539.37 | 1843.36 | 822.3 |
| 34 | NAGALAND | 10611.05 | 7000.08 | 8231.2 | 2655.9 |
| 35 | SIKKIM | 644.34 | 481.21 | 450.66 | 194.27 |
| 36 | TRIPURA | 4010.56 | 6456.59 | 7781.78 | 2993.23 |
| Total | 680065.05 | 790689.99 | 847591.84 | 312270.81 |
Annexure-IV
State/UT-wise Funds released in Scheme for Adolescent Girls during last 3 years and current year
(₹ in lakhs)
| S. No. | States/UTs | 2016-17 | 2017-18 | 2018-19 | 2019-20 |
| 1 | Andhra Pradesh | 762.99 | 2259.52 | 1011.98 | 74.82 |
| 2 | Arunachal Pradesh | 126.25 | 87.96 | 0 | 32.34 |
| 3 | Assam | 1356.94 | 341.92 | 0 | 38.73 |
| 4 | Bihar | 2696.83 | 4003.74 | 25.54 | 463.92 |
| 5 | Chhattisgarh | 1389.69 | 2792.61 | 724.75 | 48.4 |
| 6 | Goa | 131.5 | 302.77 | 0.4 | 0.05 |
| 7 | Gujarat | 8443.18 | 2690.09 | 5092.44 | 838.87 |
| 8 | Haryana | 104.74 | 589.97 | 37.41 | 18.96 |
| 9 | Himachal Pradesh | 720.45 | 1129.42 | 0 | 0 |
| 10 | Jammu & Kashmir | 194.63 | 255.91 | 560.39 | 46.53 |
| 11 | Jharkhand | 145.57 | 1495.55 | 0 | 254.39 |
| 12 | Karnataka | 740.73 | 2466.93 | 923.76 | 992.64 |
| 13 | Kerala | 1057.73 | 692.91 | 289.74 | 1.08 |
| 14 | Madhya Pradesh | 5302.02 | 8641.18 | 5442.4 | 767.44 |
| 15 | Maharashtra | 5334.42 | 3995.68 | 3536.78 | 539.06 |
| 16 | Manipur | 49.65 | 170.28 | 0 | 12.61 |
| 17 | Meghalaya | 919.65 | 528.83 | 12.55 | 14.85 |
| 18 | Mizoram | 91.78 | 123.95 | 69.32 | 13.16 |
| 19 | Nagaland | 206.31 | 193.14 | 214.3 | 25.02 |
| 20 | Odisha | 2867.25 | 2442.6 | 866.77 | 72.6 |
| 21 | Punjab | 0 | 40.6 | 26.3 | 0 |
| 22 | Rajasthan | 0 | 39.38 | 0 | 0 |
| 23 | Sikkim | 32.54 | 15.42 | 0 | 0 |
| 24 | Tamil Nadu | 2655.26 | 3196.22 | 0 | 95.48 |
| 25 | Telangana | 572.39 | 81.4 | 107.49 | 121.85 |
| 26 | Tripura | 334.81 | 674.38 | 19.16 | 18.48 |
| 27 | Uttar Pradesh | 10932.99 | 4486.13 | 1000.35 | 1827.57 |
| 28 | Uttaranchal | 43.02 | 3.3 | 0 | 0 |
| 29 | West Bengal | 40.41 | 282.47 | 101.85 | 126.72 |
| 30 | A & N Islands | 107.05 | 51.35 | 3.18 | 0.87 |
| 31 | Chandigarh | 12.11 | 12.68 | 2.33 | 2.06 |
| 32 | Daman & Diu | 14.14 | 14.14 | 4.53 | 0 |
| 33 | D & NH | 16.44 | 16.44 | 4.94 | 0.21 |
| 34 | Delhi | 276.66 | 490.19 | 320.48 | 7.84 |
| 35 | Lakshadweep | 2.2 | 11.65 | 3.11 | 0.04 |
| 36 | Pondicherry | 17.72 | 8.81 | 1.63 | 0 |
| Total | 47700.06 | 44629.53 | 20403.88 | 6456.59 |
This information was given by the Minister of Women and Child Development, SmritiZubinIrani, in a written reply in the Rajya Sabha


